
 A Oneindia Venture


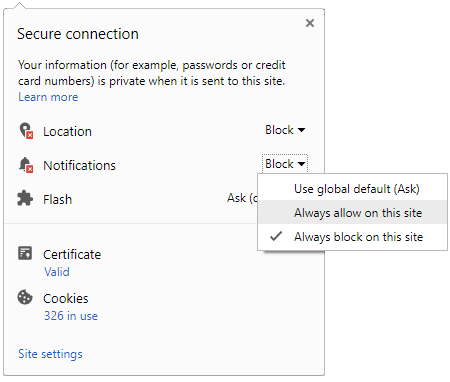
 Click it and Unblock the Notifications
Franklin India Flexi Cap Fund
3 Year Absolute Returns
37.00% ↑
NAV (₹) on 05 Nov 2026
1599.46
1 Day NAV Change
1.82%
Risk Level
Very High Risk
Rating
Franklin India Flexi Cap Fund is a Equity mutual fund categorized under Diversified, offered by Franklin Templeton Asset Management (India) Pvt. Ltd.. Launched on 29 Sep 1994, investors can start with ... Read more
NAV History
Fund Details
Returns Calculator
Asset Allocation
AUM
₹ 18,188.24 Cr
Sector Holdings
| Sectors | Weightage |
|---|---|
| Finance - Banks - Private Sector | 20.09% |
| IT Consulting & Software | 6.23% |
| Cash | 4.85% |
| E-Commerce/E-Retail | 4.41% |
| Pharmaceuticals | 4.23% |
| Power - Generation/Distribution | 4.15% |
| Refineries | 4.10% |
| Aerospace & Defense | 3.85% |
| Construction, Contracting & Engineering | 3.82% |
| Finance - Banks - Public Sector | 3.43% |
| Telecom Services | 3.32% |
| Auto - Cars & Jeeps | 3.09% |
| Cement | 2.93% |
| Hospitals & Medical Services | 2.66% |
| Finance & Investments | 2.44% |
| Engines | 2.34% |
| Edible Oils & Solvent Extraction | 2.07% |
| Iron & Steel | 1.99% |
| Airlines | 1.81% |
| Consumer Electronics | 1.72% |
| Food Processing & Packaging | 1.58% |
| Auto - LCVs/HCVs | 1.38% |
| Cycles & Accessories | 1.34% |
| Retail - Apparel/Accessories | 1.31% |
| Aluminium | 1.26% |
| Realty | 1.10% |
| Paints/Varnishes | 1.06% |
| Auto Ancl - Batteries | 1.05% |
| Beverages & Distilleries | 0.95% |
| Gems, Jewellery & Precious Metals | 0.92% |
| Financial Technologies (Fintech) | 0.83% |
| Power - Transmission/Equipment | 0.81% |
| Plastics - Plastic & Plastic Products | 0.65% |
| Non-Banking Financial Company (NBFC) | 0.61% |
| Hotels, Resorts & Restaurants | 0.44% |
| Treasury Bill | 0.43% |
| Oil Drilling And Exploration | 0.32% |
| Electronics - Equipment/Components | 0.31% |
| Services - Others | 0.12% |
Stock Holdings
| Name | Weightage | Value (in Cr.) | Sector |
|---|---|---|---|
| ICICI Bank Ltd | 6.46% | ₹ 1,175.13 | Finance - Banks - Private Sector |
| Axis Bank Ltd !! | 5.27% | ₹ 958.54 | Finance - Banks - Private Sector |
| HDFC Bank Ltd | 5.24% | ₹ 953.45 | Finance - Banks - Private Sector |
| Call, Cash & Other Assets | 4.85% | ₹ 882.97 | Others |
| Larsen & Toubro Ltd | 3.82% | ₹ 695.23 | Construction, Contracting & Engineering |
| State Bank of India | 3.43% | ₹ 624.29 | Finance - Banks - Public Sector |
| Bharti Airtel Ltd | 3.32% | ₹ 603.21 | Telecom Services |
| Eternal Ltd | 3.20% | ₹ 581.84 | E-Commerce/E-Retail |
| Kotak Mahindra Bank Ltd ! | 3.12% | ₹ 566.89 | Finance - Banks - Private Sector |
| Mahindra & Mahindra Ltd | 3.09% | ₹ 561.17 | Auto - Cars & Jeeps |
| Reliance Industries Ltd | 2.93% | ₹ 533.33 | Refineries |
| Infosys Ltd | 2.54% | ₹ 461.92 | IT Consulting & Software |
| Apollo Hospitals Enterprise Ltd | 2.52% | ₹ 459 | Hospitals & Medical Services |
| Kirloskar Oil Engines Ltd | 2.34% | ₹ 426.03 | Engines |
| Marico Ltd | 2.07% | ₹ 377.35 | Edible Oils & Solvent Extraction |
| Bharat Electronics Ltd | 2.02% | ₹ 368.14 | Aerospace & Defense |
| HCL Technologies Ltd | 2.00% | ₹ 363.28 | IT Consulting & Software |
| Tata Steel Ltd | 1.99% | ₹ 362.72 | Iron & Steel |
| Cipla Ltd | 1.92% | ₹ 348.61 | Pharmaceuticals |
| Tata Power Co Ltd | 1.90% | ₹ 346.07 | Power - Generation/Distribution |
| Hindustan Aeronautics Ltd | 1.83% | ₹ 332.52 | Aerospace & Defense |
| Interglobe Aviation Ltd | 1.81% | ₹ 329.55 | Airlines |
| NTPC Ltd | 1.73% | ₹ 313.87 | Power - Generation/Distribution |
| Britannia Industries Ltd | 1.58% | ₹ 287.39 | Food Processing & Packaging |
| Grasim Industries Ltd | 1.53% | ₹ 278.32 | Cement |
| Ultratech Cement Ltd | 1.40% | ₹ 255.18 | Cement |
| Ashok Leyland Ltd | 1.38% | ₹ 251.84 | Auto - LCVs/HCVs |
| Tube Investments of India Ltd | 1.34% | ₹ 243.11 | Cycles & Accessories |
| Trent Ltd | 1.31% | ₹ 237.82 | Retail - Apparel/Accessories |
| Hindalco Industries Ltd | 1.26% | ₹ 228.39 | Aluminium |
| Pine Labs Ltd | 1.23% | ₹ 224.29 | IT Consulting & Software |
| 360 One Wam Ltd | 1.22% | ₹ 221.83 | Finance & Investments |
| Tata Capital Ltd | 1.22% | ₹ 221.73 | Finance & Investments |
| Meesho Ltd | 1.21% | ₹ 220.13 | E-Commerce/E-Retail |
| Bharat Petroleum Corporation Ltd | 1.17% | ₹ 212.22 | Refineries |
| Prestige Estates Projects Ltd | 1.10% | ₹ 200.34 | Realty |
| Asian Paints Ltd | 1.06% | ₹ 193.58 | Paints/Varnishes |
| Exide Industries Ltd | 1.05% | ₹ 190.35 | Auto Ancl - Batteries |
| Havells India Ltd | 1.01% | ₹ 183.78 | Consumer Electronics |
| United Spirits Ltd | 0.95% | ₹ 172.56 | Beverages & Distilleries |
| Eris Lifesciences Ltd | 0.93% | ₹ 169 | Pharmaceuticals |
| Kalyan Jewellers India Ltd | 0.92% | ₹ 168.10 | Gems, Jewellery & Precious Metals |
| Ge Vernova T&D India Ltd | 0.81% | ₹ 147.13 | Power - Transmission/Equipment |
| PG Electroplast Ltd | 0.71% | ₹ 128.76 | Consumer Electronics |
| Shaily Engineering Plastics Ltd | 0.65% | ₹ 118.83 | Plastics - Plastic & Plastic Products |
| MedPlus Health Services Ltd | 0.62% | ₹ 112.12 | Pharmaceuticals |
| SBFC Finance Ltd | 0.61% | ₹ 110.42 | Non-Banking Financial Company (NBFC) |
| CESC Ltd | 0.52% | ₹ 94.21 | Power - Generation/Distribution |
| Divi's Laboratories Ltd | 0.51% | ₹ 92.92 | Pharmaceuticals |
| PB Fintech Ltd | 0.51% | ₹ 93.05 | Financial Technologies (Fintech) |
| Intellect Design Arena Ltd | 0.46% | ₹ 84.09 | IT Consulting & Software |
| Lemon Tree Hotels Ltd | 0.44% | ₹ 80.09 | Hotels, Resorts & Restaurants |
| Oil & Natural Gas Corporation Ltd | 0.32% | ₹ 57.50 | Oil Drilling And Exploration |
| One 97 Communications Ltd | 0.32% | ₹ 57.46 | Financial Technologies (Fintech) |
| Syrma SGS Technology Ltd | 0.31% | ₹ 55.90 | Electronics - Equipment/Components |
| 91 DTB (05-Nov-2026) | 0.27% | ₹ 49.75 | Others |
| Syngene International Ltd | 0.25% | ₹ 45.47 | Pharmaceuticals |
| 91 DTB (24-Dec-2026) | 0.16% | ₹ 29.62 | Others |
| Metropolis Healthcare Ltd | 0.14% | ₹ 24.80 | Hospitals & Medical Services |
| Teamlease Services Ltd | 0.12% | ₹ 21.08 | Services - Others |
Returns
| Annualised returns | ||||
|---|---|---|---|---|
| 9M | 1Y | 2Y | 3Y | |
| Fund returns | -2.31% | -4.14% | 0.08% | 11.07% |
| Category returns | 3.89% | 1.91% | 5.49% | 39.02% |
Fund Objective
Aims to provide growth of capital plus regular dividend.
AMC Details
Top Funds from Equity - Flexi Cap
|
Scheme Name
|
NAV
|
Returns
1Y
3Y
5Y
|
AUM (Cr)
|
Expense Ratio
|
Risk Meter
|
||
|---|---|---|---|---|---|---|---|
|
ITI Flexi Cap Fund - Direct Plan
Diversified
Direct
|
₹21.56 | 13.32% | 72.81% | 0.00% | ₹1,588 | 0.91% |
Very High
|
|
Bank of India Flexi Cap Fund - Direct Plan
Diversified
Direct
|
₹42.20 | 8.01% | 70.02% | 107.98% | ₹3,098 | 0.85% |
Very High
|
|
Bank of India Flexi Cap Fund - Direct Plan
Diversified
Direct
|
₹36.06 | 8.00% | 69.93% | 107.96% | ₹3,098 | 0.85% |
Very High
|
|
Bank of India Flexi Cap Fund - Direct Plan
Diversified
Direct
|
₹36.06 | 8.00% | 69.93% | 107.96% | ₹3,098 | 0.85% |
Very High
|
|
ITI Flexi Cap Fund - Direct Plan
Diversified
Direct
|
₹20.88 | 9.76% | 67.38% | 0.00% | ₹1,588 | 0.91% |
Very High
|
|
ITI Flexi Cap Fund - Direct Plan
Diversified
Direct
|
₹20.88 | 9.76% | 67.38% | 0.00% | ₹1,588 | 0.91% |
Very High
|
|
Invesco India Flexi Cap Fund - Direct Plan
Diversified
Direct
|
₹21.23 | 4.43% | 66.38% | 0.00% | ₹5,437 | 0.86% |
Very High
|
|
360 ONE Flexi Cap Fund - Direct Plan
Diversified
Direct
|
₹17.22 | 7.39% | 65.39% | 0.00% | ₹2,246 | 0.92% |
Very High
|
|
360 ONE Flexi Cap Fund - Direct Plan
Diversified
Direct
|
₹17.22 | 7.39% | 65.39% | 0.00% | ₹2,246 | 0.92% |
Very High
|
|
360 ONE Flexi Cap Fund - Direct Plan
Diversified
Direct
|
₹17.22 | 7.39% | 65.39% | 0.00% | ₹2,246 | 0.92% |
Very High
|
Top Funds from Franklin Templeton Asset Management (India) Pvt. Ltd.
FAQs
What is the current NAV of Franklin India Flexi Cap Fund Regular Growth?
What is the fund size (AUM) of Franklin India Flexi Cap Fund Regular Growth?
What are the historical returns of Franklin India Flexi Cap Fund Regular Growth?
What is the risk level of Franklin India Flexi Cap Fund Regular Growth?
What is the minimum investment amount for Franklin India Flexi Cap Fund Regular Growth?
Disclaimer: This is 3rd Party content/feed, viewers are requested to use their discretion and conduct proper diligence before investing, GoodReturns does not take any liability on the genuineness and correctness of the information in this article
-
Block for 8 hours
-
Block for 12 hours
-
Block for 24 hours
-
Don't block

 Sign in with Google
- Male
- Female
- Others
- Under 18
- 18 to 25
- 26 to 35
- 36 to 45
- 45 to 55
- 55+